We care about your data, read our privacy policy.

One graph. Many benefits.

Clear numbers & relationships
See all key numbers in a single connected view instead of a myriad of dashboards. Now everyone understands how the company is doing.

Clear influences

Clear ownership

Less metrics. More action.
Build scenarios how a change in lower level metric impacts higher level metrics right to the MRR or your North star metric. Compare scenarios by their expected impact on key metrics.


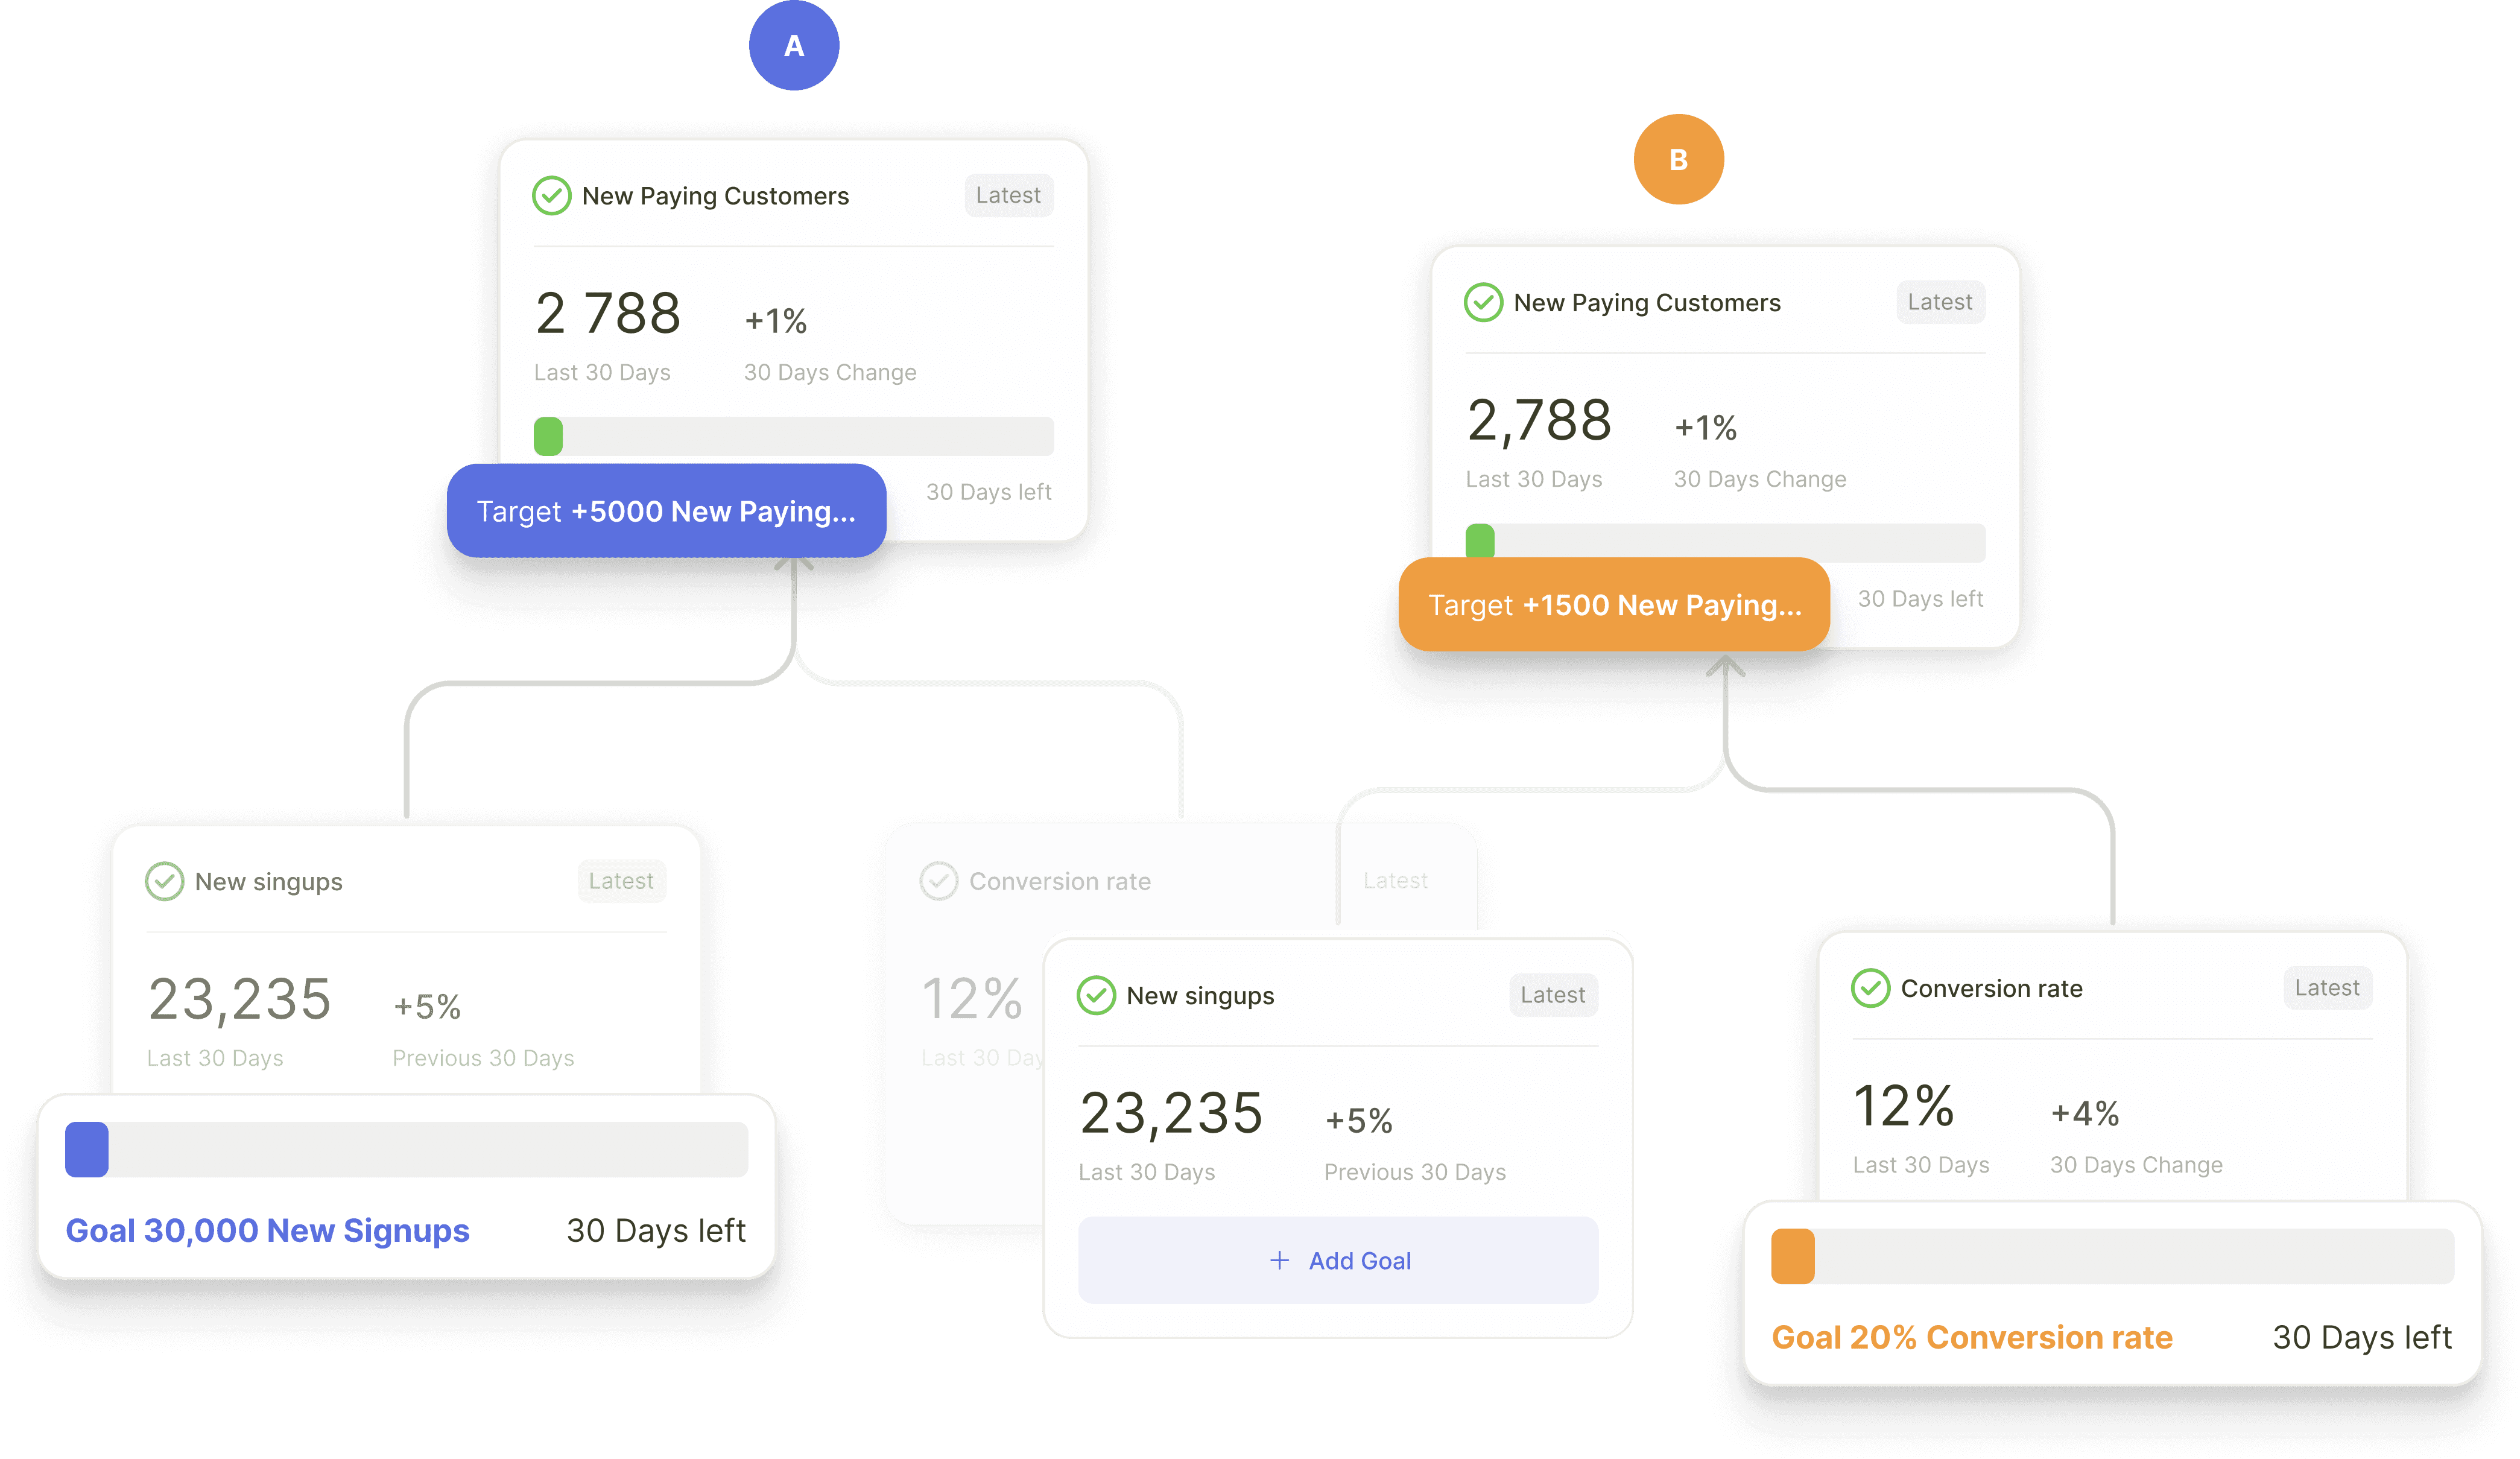
Set goals. Track progress.

Analyze drifts.

Understand the Context
Leverage parameters of related records to explore your data, unveiling deeper insights and informing strategic decisions.

Data connectors
Pre-built connectors with the most popular data sources like Stripe, Shopify, Mixpanel, Amplitude, Intercom, Zapier and others.
Analytics
Uncover the “why” behind the metrics
CRM
Quantify the cost of missing features

Support
Understand what customers did before reaching out.

Payments
See what “drives” new customers and their retention
Data storage
Connect all data for better decision making
Start now by using growth model templates and pre-built connectors to the most popular data sources. Do it in minutes.
Product
Growth model
Growth cycles
Growth analytics
Metrical platform
Pricing
Integrations
Change log
Company
About
Contact US
Resources
Help Center
Developers